When support performance is measured solely by speed, you miss what really matters: visibility. Most Slack-based teams know this problem well.
Sixty-eight percent of the leaders we spoke with said they struggle to measure team efficiency. This is because essential signals are scattered across threads, direct messages, and side conversations. This guide explains a better way to track support performance inside Slack using ClearFeed. It is relevant to teams that provide Customer Support via Slack - or those who are managing IT / HR Support on Slack.

TL;DR
A practical walkthrough of measuring Slack support performance using ClearFeed Insights, covering which metrics to track, how to slice the data, and when each aggregation type actually tells you something useful.
The gist
- Six core metrics available in ClearFeed Insights: Number of Requests (load), First Response Time (responsiveness), Resolution Time (efficiency), Resolution Rate (follow-through), CSAT (customer happiness), and % SLA Breached for first response, resolution, and one-touch.
- Every metric can be broken down by channel name, priority, assignee, owner, or product edition — making it possible to identify which channels are lagging, which agents are overloaded, and which product areas generate repeat volume.
- For timing metrics like First Response Time, use average for a quick overall read, median for what customers typically experience (especially when outliers skew average), and percentiles (p75/p90/p95) to understand worst-case scenarios affecting top customers.
- To spot stuck or prematurely closed requests, compare Resolution Time against First Resolution Time — a fast first resolution but long overall resolution time usually means customers are reopening after incomplete fixes.
- Custom reports can be saved, shared with the team, exported to CSV, or connected to Google Sheets for auto-refreshing dashboards — useful for weekly SLA reviews and leadership decks.
Worth knowing: Business Hours and SLA policies must be configured correctly before reading breach data — otherwise off-hours and weekends inflate timing metrics and make the team look worse than it is.
What We’ll Measure
ClearFeed Insights gives you the operational signals that matter for Slack-based support: request volume, timing metrics (first response, response time, resolution time, first resolution time), SLA breach rates, CSAT (2- or 5-point), and more.
You can filter by channel, responder, priority, and custom fields; apply a date range; and even break down any metric by up to three dimensions in tabular views.
What You’ll Need Before Measuring
Before you can track these metrics, you’ll need a ClearFeed account connected to your Slack workspace. If you’re not set up yet, go to the ClearFeed web app (or clearfeed.ai) and sign up with your Slack workspace, then install the ClearFeed Slack app in the workspace where you handle support conversations.
Once that’s in place, confirm that:
- You’ve set up Collections (Slack support channels or DMs where requests are captured).
- You’re converting Slack messages into Requests/Tickets (via emoji reactions, keywords, or automated triage).
- You’ve configured Business Hours and SLA policies (so timing is fair).
- You’re using ClearFeed Insights (In the Web App, go to Insights from the left navigation bar) and have selected All Requests.
When the ClearFeed Web App loads, you’ll land on the Shared Reports > Default view. This is a starting dashboard that shows trends in support activity, like how many requests your team received over time. Here’s how to make it actionable.

Choose the Right Metric (What Are You Measuring?)
At the top left of the Insights dashboard, you will see the Metric dropdown. This is where you decide what specific aspect of your support performance you want to focus on. Each metric serves a different purpose and aligns with a particular operational goal. Here's how to think about your choice:
Add Breakdowns (Where Is Performance Strong or Slipping?)
Use the Breakdown By dropdown to slice your selected metric across key dimensions. This helps you uncover not just problem areas, but also bright spots you can learn from or scale.
How Do I Measure How Fast My Team Is Responding?
Go to the Metric dropdown menu and pick "First Response Time." This shows how long it takes your team to send the first reply to a new Slack request.

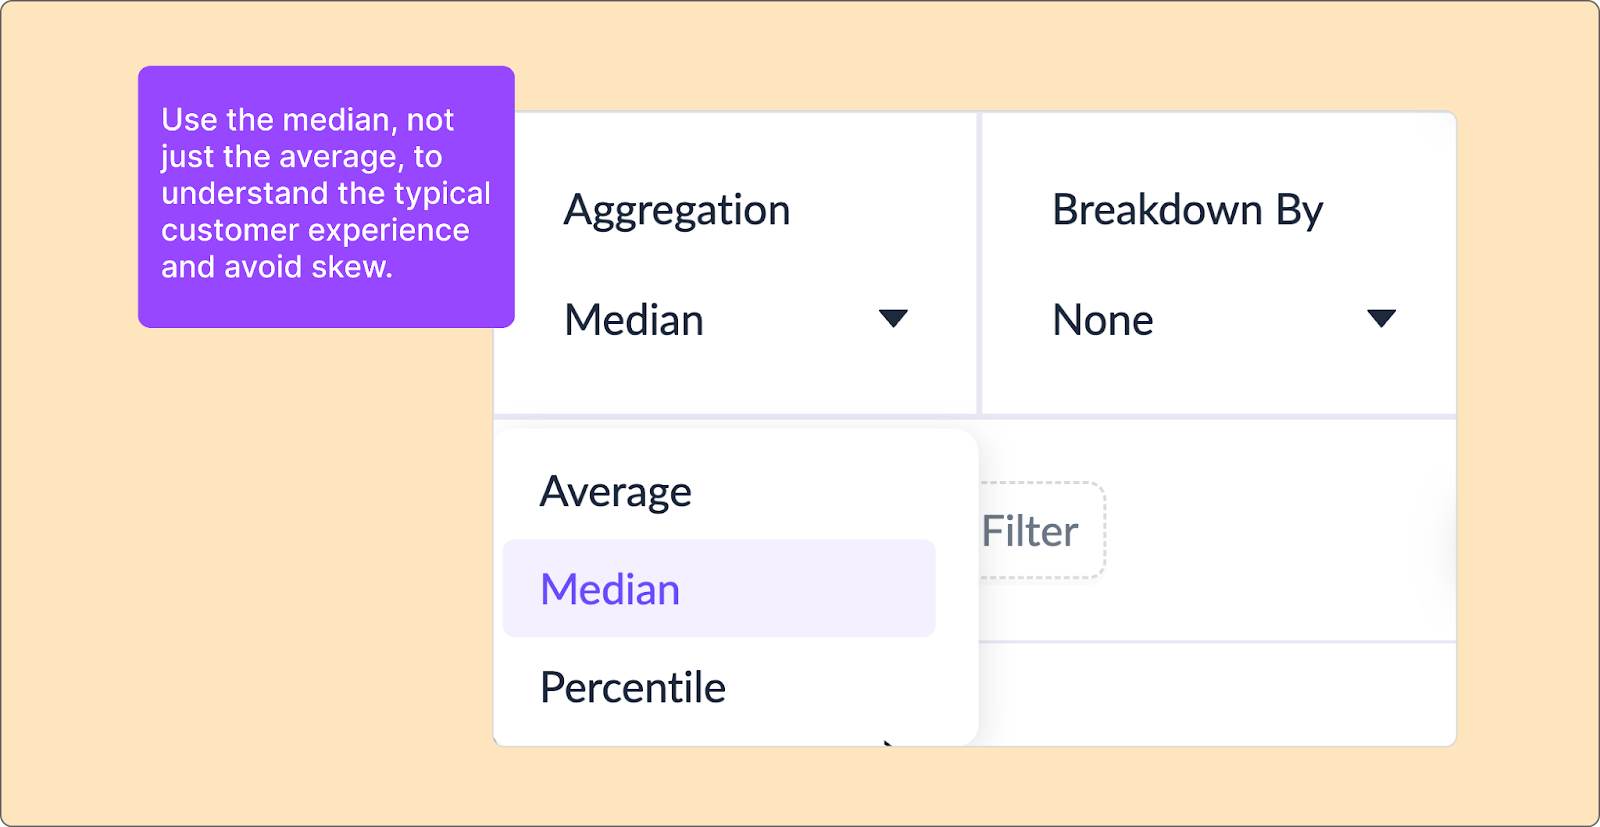
When you pick a metric like First Response Time, ClearFeed lets you view the data in different ways, each revealing a slightly different story about your team’s performance.
- Average: Adds up all response times and divides by the total.
When to use:
- For a quick, overall sense of speed.
- Best when your data is consistent (no extreme delays).
- Median: Shows the middle value. This means half of the responses were faster than this time, and half were slower.
When to use:
- For the real story of what customers typically experience.
- Especially useful when your team has a few very slow outliers.
- Percentiles (p75 / p90 / p95): Shows how long it took to reply to 75%, 90%, or 95% of requests.
When to use:
- To understand worst-case scenarios or delays affecting your top customers.
- To identify how “bad” the slowest edge of your response curve gets.
How Can I Evaluate and Support My Team’s Workload and Performance?
For a clear view of work distribution across your team, first select the "Number of Requests" metric and break it down by "Assignee." This shows how many support conversations each person handled.
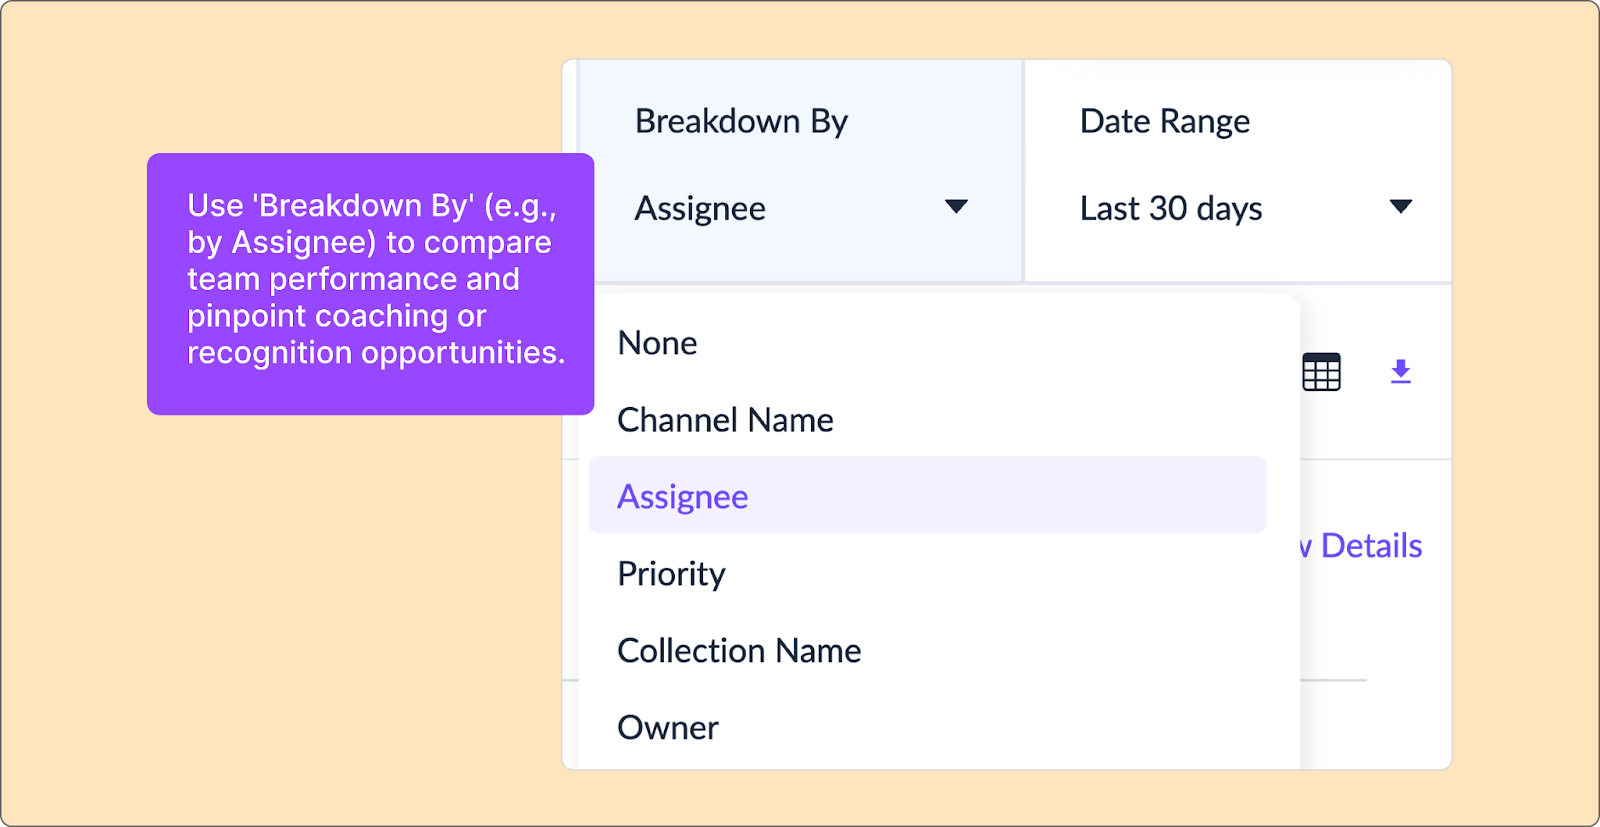
Next, combine this with metrics like "Resolution Time" to see how workload affects results. This can reveal patterns, such as recognizing agents who efficiently handle many requests with fast resolution times.
Are We Meeting Our SLA Targets for Slack-Based Support Operations?
You can check your SLA compliance in the Metrics tab. There, you will see the percentage of requests that missed your targets for the First Response, Resolution, or One-Touch SLAs. These percentages are calculated based on the specific SLA policies you have configured in ClearFeed.

Break the data down by Collection, Channel, or Priority to see where breaches are concentrated. For instance, you may find that breaches happen more frequently for requests coming through a particular customer channel or for tickets labeled with a specific product tag.
Note: Make sure your Business Schedule is correctly configured so off-hours and weekends are excluded from timing calculations. This ensures breach data reflects your team's actual working hours.
Which Slack Channels or Customers Generate the Most Volume?
In the Requests section, select Number of Requests as the metric and use Breakdown By → Channel Name or Author. This will show you which Slack channels (or which individual requesters) are generating the most support volume.
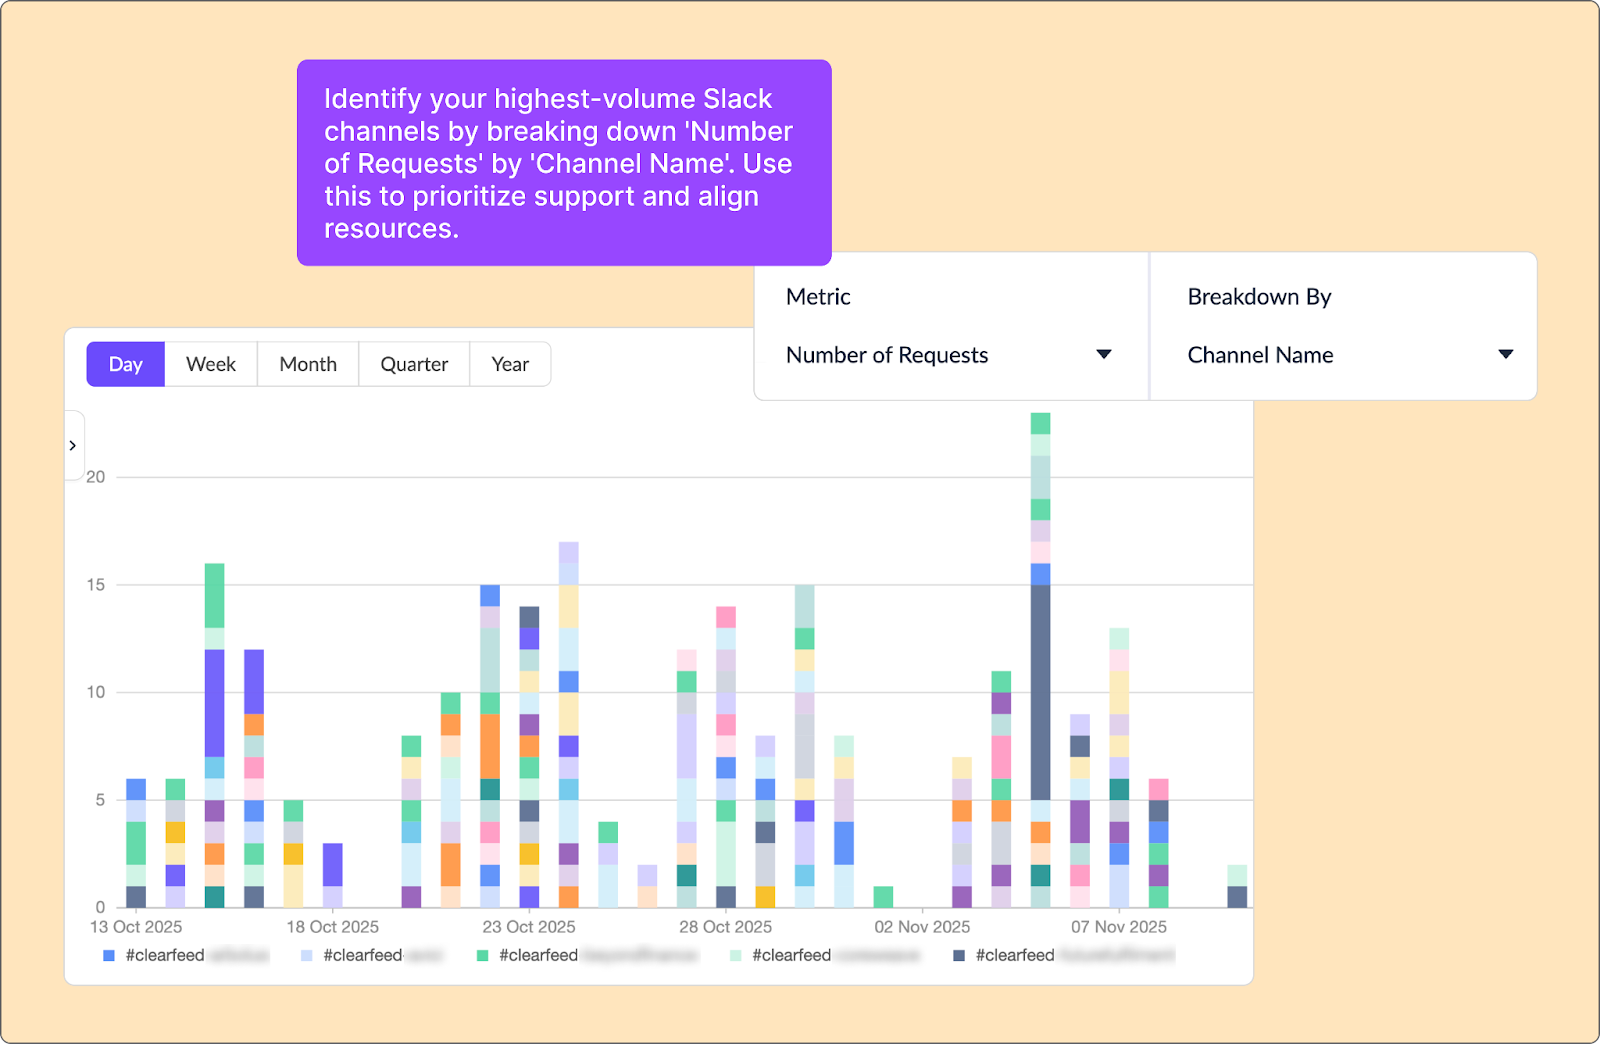
This data is useful when deciding how to distribute load across your team or when preparing account-level reviews. If a customer’s support volume has increased significantly, it may indicate product confusion, onboarding friction, or a shift in their usage.
How Satisfied Are Customers With Our Slack Support?
You can measure your customer satisfaction score by selecting "Customer Satisfaction (CSAT)" from the Metric dropdown. This metric shows the feedback customers provide after their support ticket is resolved. ClearFeed supports two types of feedback:
- 👍/ 👎 (binary) surveys: CSAT 2-Point Survey - Negative Responses and CSAT 2-Point Survey - Positive Responses
- ⭐ 1–5 rating scale surveys: CSAT 5-Point Survey
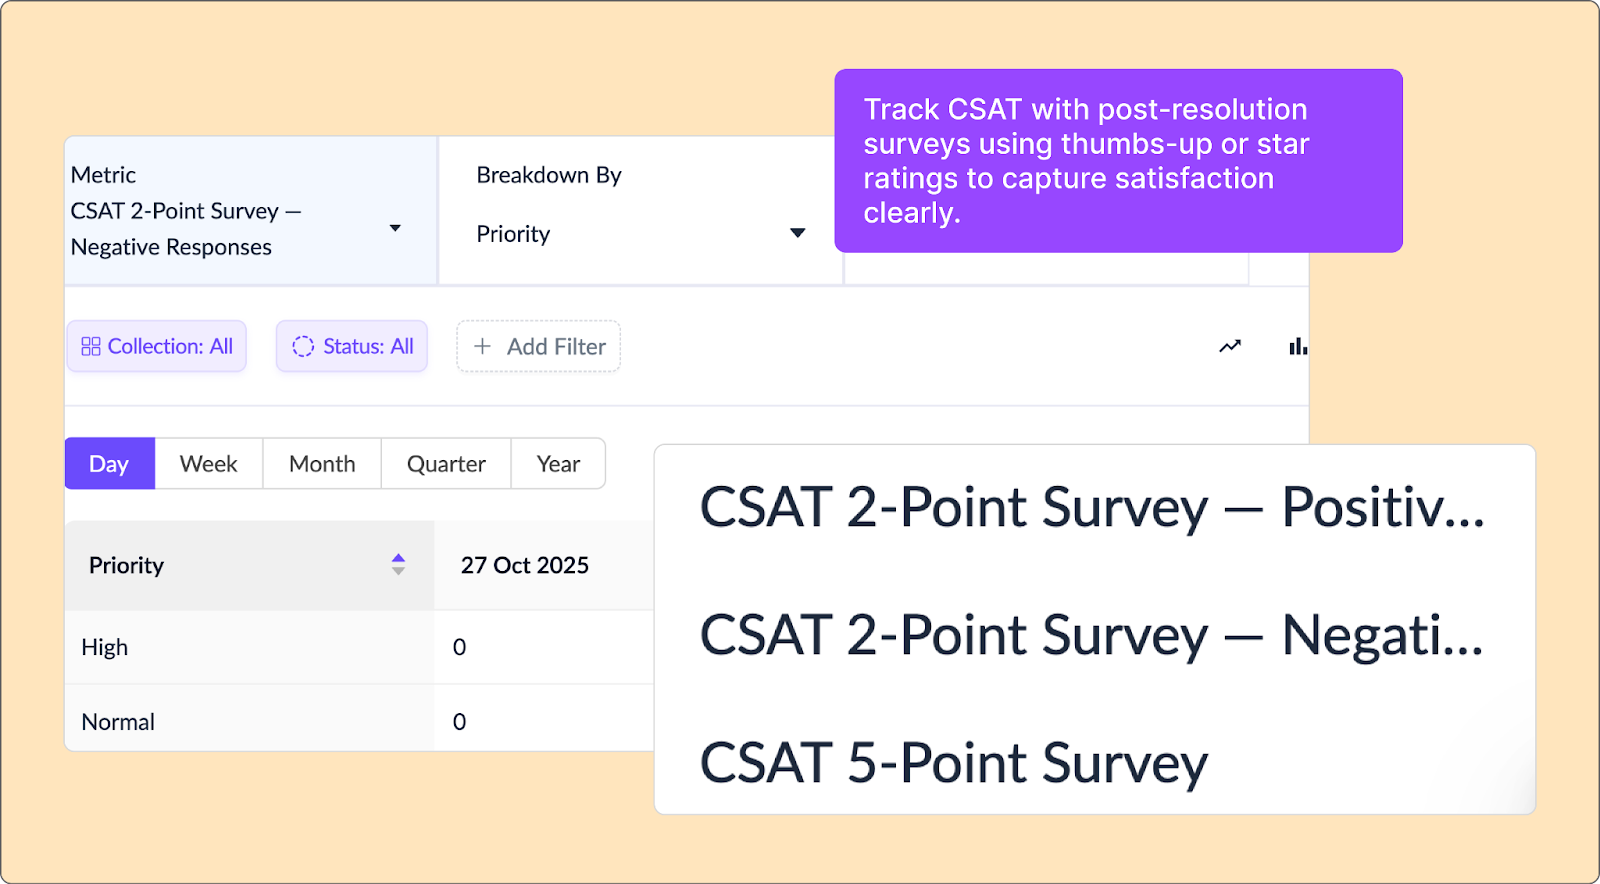
These are automatically sent after ticket closure and captured in the Insights dashboard.
You can make your analysis more targeted by using filters. Select Tickets, then choose Requests with ticket, High Priority, or Specific Channel. This allows you to break down your CSAT score by request type or customer group. If you see your CSAT score declining, you can check metrics such as resolution time, reopen rate, and SLA breach rate to identify the root cause.
Where Are Requests Getting Stuck or Reopened in Slack?
Requests that drag on too long or get reopened can indicate poor handoffs or incomplete resolutions. In the Requests tab, compare Resolution Time with First Resolution Time. If the first resolution is fast but the overall resolution time is long, it likely means customers are reopening their requests after premature closure.
Break the data down by Product Edition, Priority, or Channel to identify patterns. For example, if a particular product module shows a high reopen rate, the documentation or escalation path for that area may need improvement.
How Did Support Perform During a Launch or Incident?
If you want to assess how your team handled a specific event, such as a product release or outage, use the Date Range selector to choose a custom time window (for example, November 1 to November 5). Then apply breakdowns like Priority, Channel, or Assignee.
Check metrics like First Response Time, SLA Breach Rate, and CSAT to evaluate how quickly and effectively your team responded under pressure. This data is helpful for postmortems and can inform resourcing decisions for future events.
Can I Automate Weekly or Monthly Reports?
Yes, ClearFeed allows you to save any view you build as a Custom Report. Once you’ve configured your filters, date range, metric, and breakdown, click Save as new report and name it clearly (for example, “Weekly SLA Review” or “Q4 Product Issues”). You can choose Team’s View to make the report visible to others.

For sharing outside the app, you can either Export to CSV or use the Google Sheets API to create a dashboard that refreshes automatically on a daily or weekly schedule. This is ideal for leadership decks, operational reviews, or historical tracking.
Start Measuring What Actually Matters in Your Slack Support
Many teams believe they are measuring support, but they are only tracking activity. They look at message counts, response times, and ticket numbers without understanding what that data means for their customers.
Real measurement is not passive. It is a choice about what you value. You must decide whether to prioritize speed or the quality of your conversations. You must choose whether to spot team burnout early or find out about it weeks too late.
ClearFeed’s Insights shows you where problems are happening. You do not have to wait for a quarterly report. You can see it in real time, right inside the tools where your team works.
If you are still trying to understand your performance using manual reports and guesswork, start tracking what truly matters with ClearFeed.


