Table of Contents
If your team lives in Slack, it’s easy to feel busy—without knowing what’s actually changing: which channels are active, how engagement is trending, or whether collaboration is spreading across the team.
That’s where Slack analytics helps. It’s Slack’s built-in analytics dashboard (aka the workspace analytics dashboard) that shows high-level activity across your workspace—member engagement, messaging volume, and channel-level participation.
A critical note up front: Slack analytics is excellent for usage and adoption, but it’s not designed to support KPIs such as response time, thread-level resolution, or visibility into every private conversation. This Slack analytics tutorial shows how to see Slack analytics in a few clicks.
Next, let’s quickly define what Slack analytics includes(and what it doesn’t).
TL;DR
Slack analytics is useful for workspace adoption and channel activity, but support teams need deeper tooling to track response times, SLAs, ownership, and request outcomes.
The gist
- Slack’s analytics dashboard shows member activity, message volume, and channel participation.
- Teams can access it from desktop via workspace name, Tools & settings, then Slack analytics dashboard.
- Native Slack reports do not show first response time, resolution time, SLA breaches, thread outcomes, or request ownership.
- Weekly reviews should look for adoption trends, inactive channels, DM-heavy work, and high-volume channels with repeated questions.
- ClearFeed adds support analytics for requests, Slack messages, response time, resolution time, SLA breach percentages, and breakdowns by channel, agent, owner, or status.
Worth knowing: Slack analytics answers “how is the workspace being used?” ClearFeed is positioned for “how well are we supporting customers in Slack?”
What Is Slack Analytics?
Slack analytics is Slack’s built-in reporting view that helps you understand how people are actually using your workspace—think Slack stats/Slack statistics you can use to spot trends, adoption, and engagement over time.
Inside the Slack analytics dashboard (sometimes people casually call it a Slack dashboard), you can quickly answer questions like:
- “Are we messaging more or less this month?” (Slack metrics around messages + active members)
- “Which channels are growing vs. going quiet?” (channel activity + participation)
- “Is engagement spreading across the team or concentrated in a few people?” (workspace-level activity trends)
If you’re here for Slack analytics because you run support in Slack: Slack analytics is strong on workspace usage—but it’s not built to measure support KPIs (like response time or thread-level resolution).
How To Access the Analytics Dashboard in Slack?
If you’re looking for how to view Slack analytics (or how to see Slack analytics), the fastest path is through your workspace menu on desktop.
Desktop (Most Common)
- Open Slack on desktop
- Click your workspace name (top-left)
- Go to Tools & settings → Slack analytics dashboard (Workspace analytics)
- Change the time window (e.g., last 28/30 days vs all-time)
- Optional: Export to download the data
This is the core Slack analytics tutorial most people need when they search for Slack analytics dashboard / Slack insights instructions.
Enterprise Grid / Org-Level Analytics (if You Manage Multiple Workspaces)
If you’re an org admin/owner and want organization-wide reporting (not just one workspace), you’ll typically find it under Org settings → Analytics, and then you can pick the workspace(s) you want to review.
If You Don’t See “Workspace Analytics”
This is usually one of these:
- You’re on mobile (desktop is the most reliable place to access the full analytics for the Slack dashboard)
- Your role/permissions restrict access to analytics
- Your workspace plan/settings limits which tabs you can see
Once you’re inside the Slack analytics dashboard, the next question is: what exactly can you measure here (messages, channels, members)… and what can’t you measure?
What Can You Measure With Slack Analytics?
Inside the Slack analytics dashboard, you’ll find three buckets of Slack metrics (aka Slack stats/Slack statistics) that tell you how your workspace is being used: member activity, messaging volume, and channel participation.
1) Workspace and Member Activity (Slack Workspace Analytics / Slack Activity Report)
Use this to understand adoption and engagement over time:
- Total members joined (overall workspace size trend)
- Weekly active members (how many people are actually using Slack)
- Per-user details like:
- Days active in a selected time range
- Messages sent per user
- Last active timestamp
2) Messaging (Slack Message Analytics)
Use this to understand how conversation volume is changing:
- Messages sent on a specific date (this is what many people mean by Slack analytics messages posted)
- Messages read in public vs. private
- Number of direct messages sent
- Messages sent in public vs. private channels
If you’re looking to see how many Slack messages I've sent, check the Members view in analytics, where Slack shows message counts by user (within the selected date range).

3) Channel Analytics (Slack Channel Analytics / Slack Channel Metrics)
Use this to see which channels are active and how participation looks:
- Number of users in a channel
- Count of messages posted
- Number of people participating (posting or reading)
Quick Note on Slack Reporting
Most teams use these Slack statistics in weekly reviews by:
- Changing the date range (last 28/30 days vs. all-time)
- Exporting the report to share outside Slack
Next, I’ll cover what Slack doesn't track in analytics (where support teams often hit limits).
What’s Missing From Slack Analytics (and Why It Matters)
This is the part most “safe” competitors gloss over: Slack analytics is helpful, but it’s not built to answer operational questions—especially for support, IT, or any team running workflows within channels.
Here’s what the Slack analytics dashboard typically doesn’t give you (even if you’re searching for it):
1) No Response-Time or SLA Reporting
You can see messaging volume, but Slack reporting won’t tell you:
- how long it took to respond to a customer message
- whether a request missed an SLA window
- average time to first response/time to resolution
So if your intent with Slack analytics is “support analytics,” Slack’s built-in view will quickly feel incomplete.
2) Limited Visibility Into Threads + Outcomes
You might want Slack message analytics that answers:
- “Which requests were resolved?”
- “Which threads are still waiting?”
- “How many times did we follow up?”
Slack analytics doesn’t provide thread-level closure/outcome tracking.
3) Private Channel Reporting Is Not Clean
Many teams expect Slack channel analytics to cover everything, but private channels and private conversations don’t behave the same way for reporting. That makes “true” workspace-wide analytics tricky if a lot of important work happens privately.
4) Primitive Engagement Analytics
While Slack reports very high level engagement metrics like number of messages on a channel - that does not make it easy to understand whether customers were engaged. It does not answer questions like when the last time each customer engaged on a customer channel or what the sentiment and satisfaction score maybe on that channel over the last 30 days (for example).
5) No Workflow Context (Tickets, Ownership, Status)
Slack analytics won’t tell you:
- who owns a request
- what status it’s in
- what category it belongs to
- what tool it was escalated to (Jira, Zendesk, etc.)
How To Use Slack Analytics?
Once you’ve opened the Slack analytics dashboard/workspace analytics dashboard, don’t just “look at numbers.” Use this simple Slack analytics tutorial to pull actionable Slack insights instructions every week.
1) Adoption Check (Is Usage Growing or Stalling?)
In Slack workspace analytics, scan:
- Active members trend (up/down vs last period)
- Messages sent trend (steady, spiky, dropping)
What to do with it: If active members are flat but messages are rising, engagement may be concentrated (a few heavy users). If both are falling, adoption is slipping—time to fix onboarding and channel hygiene.
2) Channel Health Check (Where Collaboration Is Happening)
In Slack channel analytics/Slack channel statistics, look for:
- Channels with lots of members but low participation
- Channels with high message volume but repeated questions
What to do with it: Archive/merge zombie channels, pin FAQs in high-traffic channels, and rename channels so people route work correctly.
3) Messaging Mix (DM-Heavy vs Transparent Teamwork)
In Slack message analytics, compare:
- Public vs private channel activity
- DM volume patterns
What to do with it: If DMs dominate, important decisions may get buried. Nudge recurring topics into public channels, create a “decisions + updates” channel, and pin weekly summaries.
4) Make It Shareable (Lightweight Slack Reporting)
Use export (or a quick screenshot summary) to create a weekly “2-slide” recap:
- 1 slide: top trends (members + messages)
- 1 slide: channel takeaways (what to archive, what to fix)
This keeps Slack stats/Slack metrics from becoming vanity numbers—and turns them into consistent ops.
Slack Message Analytics: Answering the Most Searched Questions (Messages Posted, Message Count, “How Many Have I Sent?”)
Businesses using Slack analytics to understand their team's internal collaboration and customer engagement can significantly benefit from integrating ClearFeed, as it provides access to advanced metrics beyond Slack's native capabilities.
ClearFeed is an AI-powered platform that operates within Slack to enhance customer service capabilities. Its core focus is to refine customer processes by providing insightful analytics derived from team and customer interactions.
With ClearFeed’s Slack Insights, you can understand customer request load, response times, service level management, and more. Channel, responder, owner, assignee, and collection can be used to break down this data. The reporting features several metrics, including:
- Number of Requests (a request being a unit of customer interaction that can span many messages)
- Number of Slack Messages
- Time to First Response (to Customer Requests)
- Time to Response (to any Customer message)
- Resolution Time (of a Customer Request)
- First Resolution Time (of a Customer Request)
- First Response and Resolution Time SLA-Breached Percentages
For any applied metric, you can also break up the data by various parameters (request status, channel, agent, etc.). It also has sub-filters, such as channel, status, and priority, to further refine the data.
By integrating Slack with ClearFeed Analytics, we can effectively address the frequent inquiries of Customer Success and Support teams. Here are a few illustrative examples:
How Can We Find Slack Channels With High Engagement?
By combining Slack and ClearFeed Analytics, the efficiency in addressing customer support inquiries can be significantly enhanced:
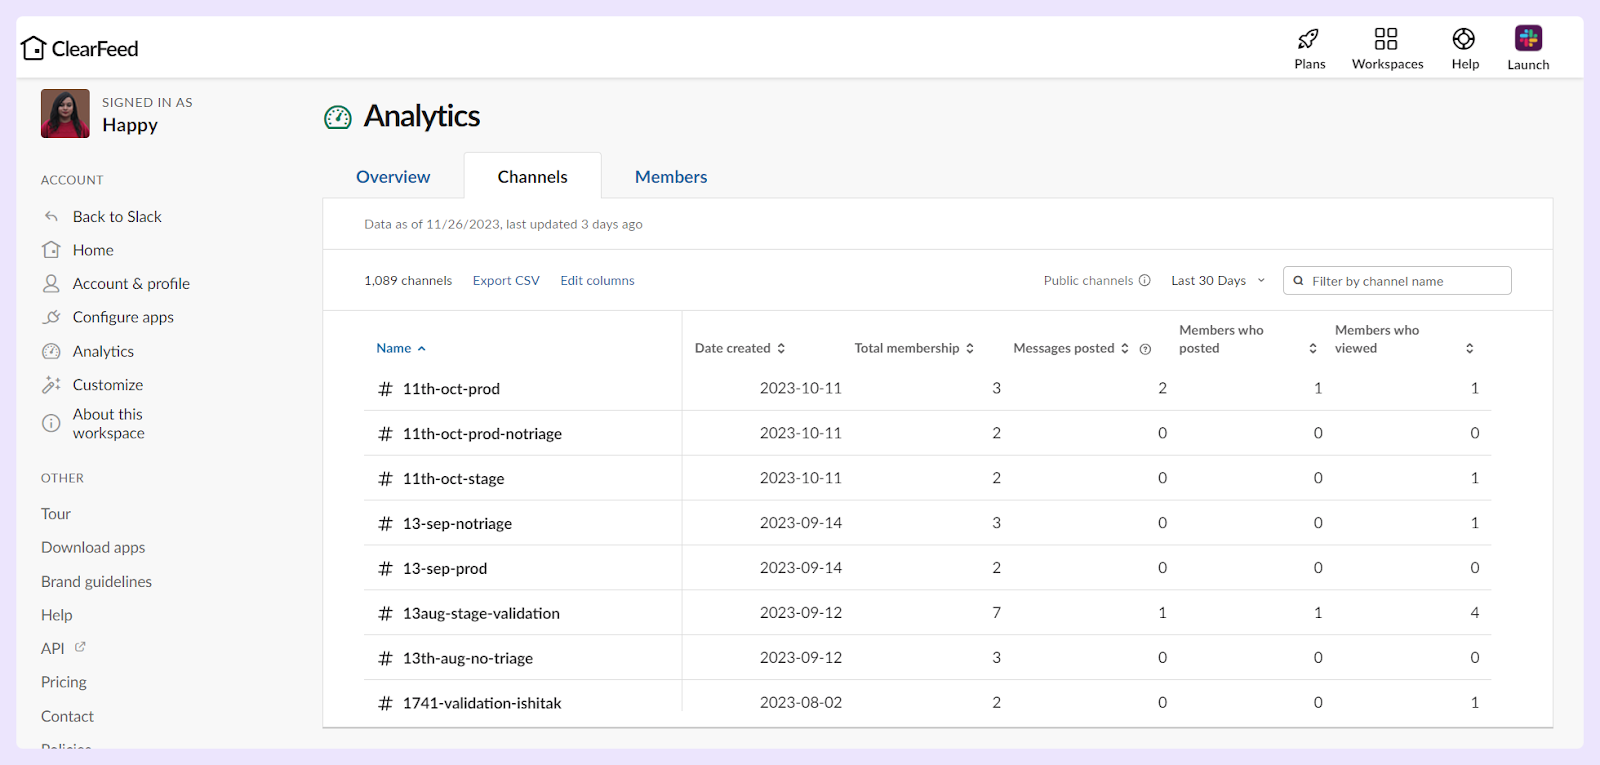
- Slack’s Channel Analytics: This feature lets you track channel engagement using message count or active user count. Consistent naming patterns for channels (e.g., a common prefix) can streamline analytics.
- ClearFeed’s Insights Module: This add-on provides deeper insights beyond message counts, focusing on interaction metrics such as customer requests. It filters out bot and support-agent messages and includes analytics for private channels. This feature makes it easy to track all customer interactions.
- Customer Interaction Reports: Using ClearFeed, reports showing customers with the highest interaction rates for specific periods can be generated effortlessly. This is made possible by pre-creating a collection of customer Slack channels and using ClearFeed to provide analytics on them. Similarly - one can also use ClearFeed APIs to build custom reports in Google Sheets (for example) that make it easy to understand which customers are not engaged.

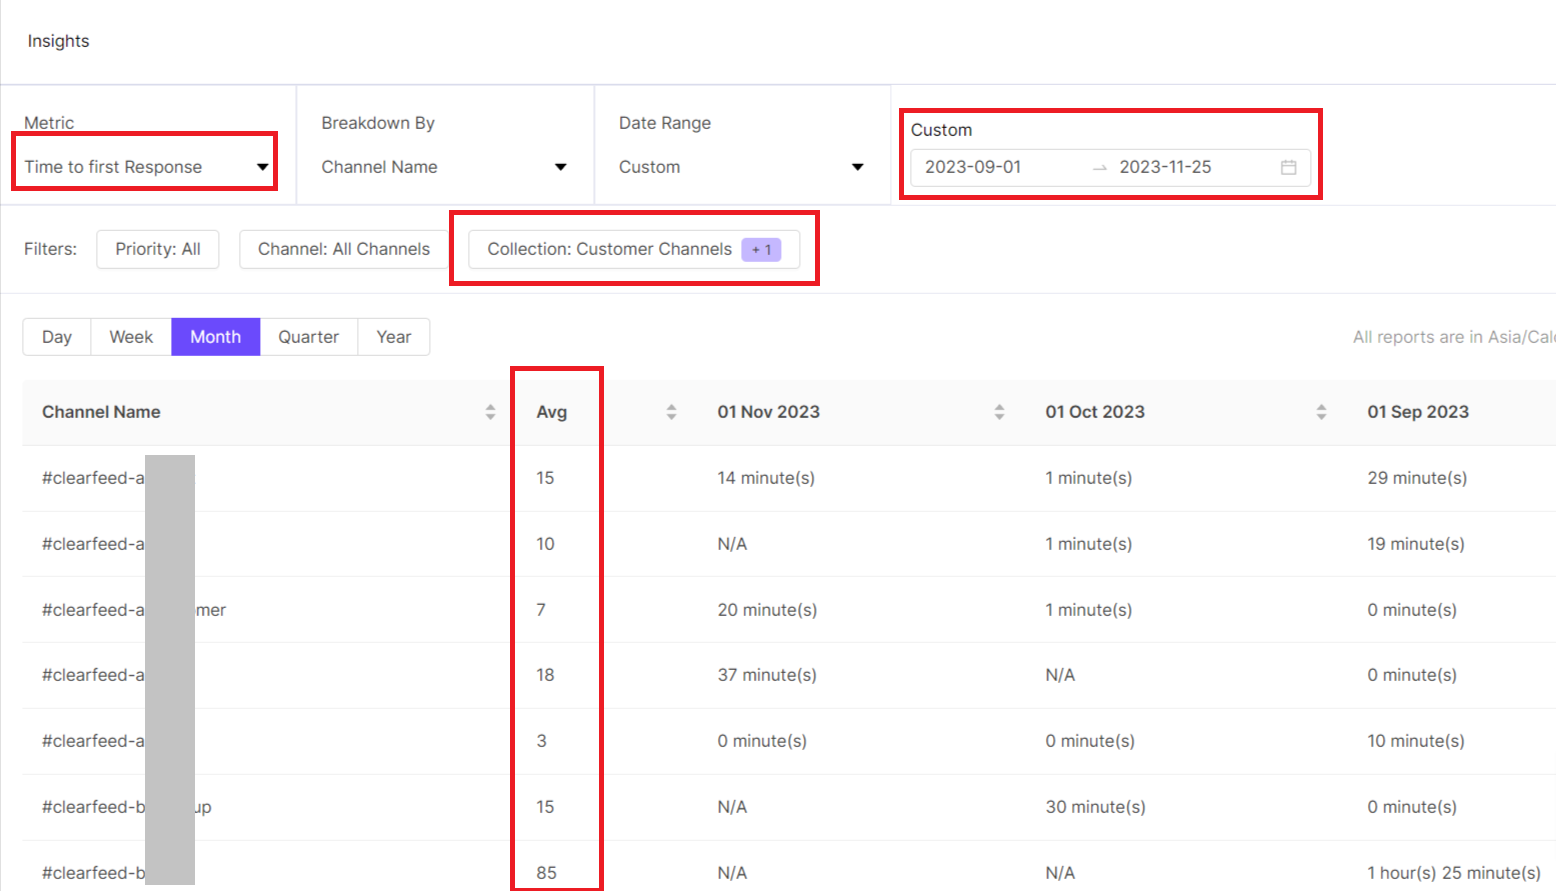
How Can We Find the Response Time in Slack Channels?
Slack Analytics lacks features regarding response time. This shortcoming can be easily addressed by using the ClearFeed Insights module. Selecting the "First Response Time" (or "Response Time") metric makes creating a channel-wise report a breeze. The following example illustrates this process for the "Customer Slack Channels" collection, which encompasses all of our customer-facing channels.
Want to know more about our Analytics and Reporting feature and how we can help you track every request on Slack? Schedule a personalized demo or start a 14-day free trial to see how you can run high-touch, measurable support directly from Slack.