Table of Contents
It's often said that a business is only as good as its last customer interaction, but focusing on the next is equally important. Long-term success hinges on employing data-driven strategies for effective customer service programs, and metrics are the backbone of any successful business, especially in customer support.
To ensure top-notch service, you need specific measures in place. Monitoring and acting on these metrics can streamline your support process and turn your team into a well-coordinated powerhouse. In the following, we'll cover key metrics in most customer service departments and why you should integrate them seamlessly into your daily operations. Let's get started, shall we?
TL;DR
Customer service teams should track a small set of operational and experience metrics, then use them to find bottlenecks, improve staffing, and raise support quality.
The gist
- First Response Time shows how quickly teams acknowledge customers; the post cites 10 minutes or less as “immediate” for many customers.
- Ticket volume metrics include total tickets, backlog, tickets by channel, and first contact resolution rate.
- CSAT and CES measure how satisfied customers are and how easy it was to get help.
- Average Resolution Time and Average Ticket Handling Time show how long issues take to resolve or manage end to end.
- NPS measures customer loyalty by subtracting detractors from promoters.
Worth knowing: Track only the metrics you’ll act on, because the value comes from finding patterns, bottlenecks, SLA risks, and service gaps.
Types of Customer Metrics Everyone Should Be Tracking
When you think of metrics, what comes to mind?
Operational metrics? Organizational metrics? Maybe a little bit of both. You see, metrics can show how well your team serves your customers and what needs to change to improve their experience.
However, you won't keep track of every metric and figure related to your business. There are too many moving parts; sometimes, good judgment requires choosing the right metrics to track. Whether you're looking for a few pointers for yourself or deciding which metrics to track, here is a list of some crucial customer metrics at all times.
For Slack-first B2B teams, the challenge is often getting every customer conversation into a measurable workflow first. ClearFeed helps by tracking requests and tickets from Slack channels, Slack Connect, Microsoft Teams, email, web chat, customer portal, and API sources inside shared collections, triage channels, and reporting views.
First Response Time (FRT)
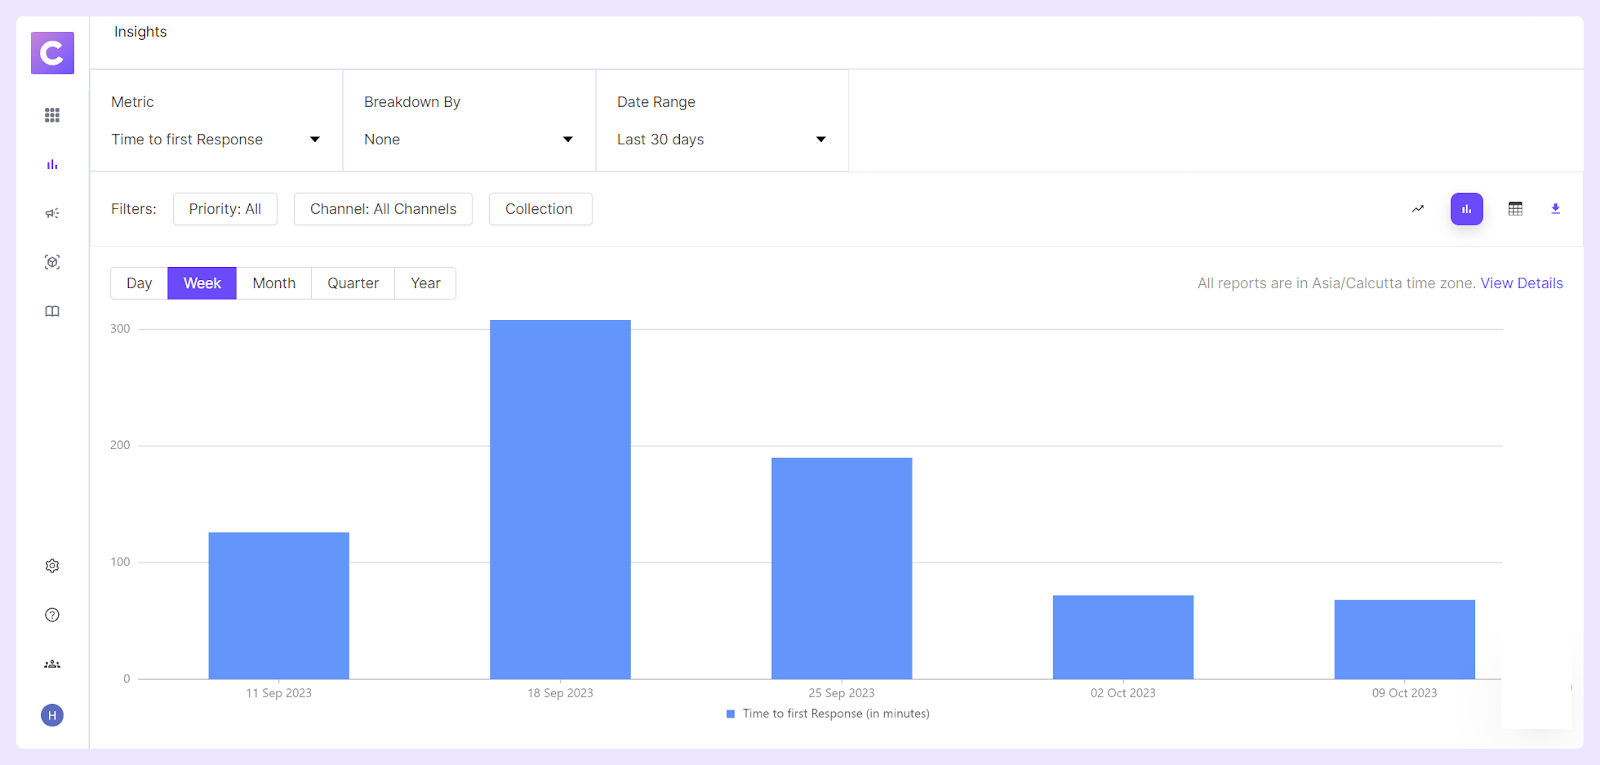
First response time refers to the time a customer support manager or a representative takes to respond to a client's initial inquiry or request assistance. This metric is crucial, where timely and efficient support is often key to maintaining strong client relationships.
According to a study done by SuperOffice, on average, it takes 12 hours and 10 minutes to address a customer service request. However, a survey done by Hubspot states that, for 90% of customers, an immediate response to a customer service query is either essential or highly significant. 60% of those surveyed said they would consider it immediate if they got a response within 10 minutes or less.
Hence, start tracking this metric to identify bottlenecks in the customer service process and implement strategies to respond to and resolve queries faster.
Ticket Volume
Ticket volume metrics refer to the total number of customer service requests or issues a company receives within a specified period. And many ticket volume metrics give different insights into what's happening. They observably serve different purposes, as listed below:
2.1. Total Ticket Volume (TTV): The total number of tickets (support requests) your team receives over a specific period. More importantly, TTV helps identify patterns or trends in customer requests that could reflect broader issues with a product or service.
Keeping an eye on the TTV can be a stepping stone to improving your product based on the nature and frequency of inquiries, enhancing resource allocation, forecasting staffing requirements accurately, and ultimately contributing to customer satisfaction.
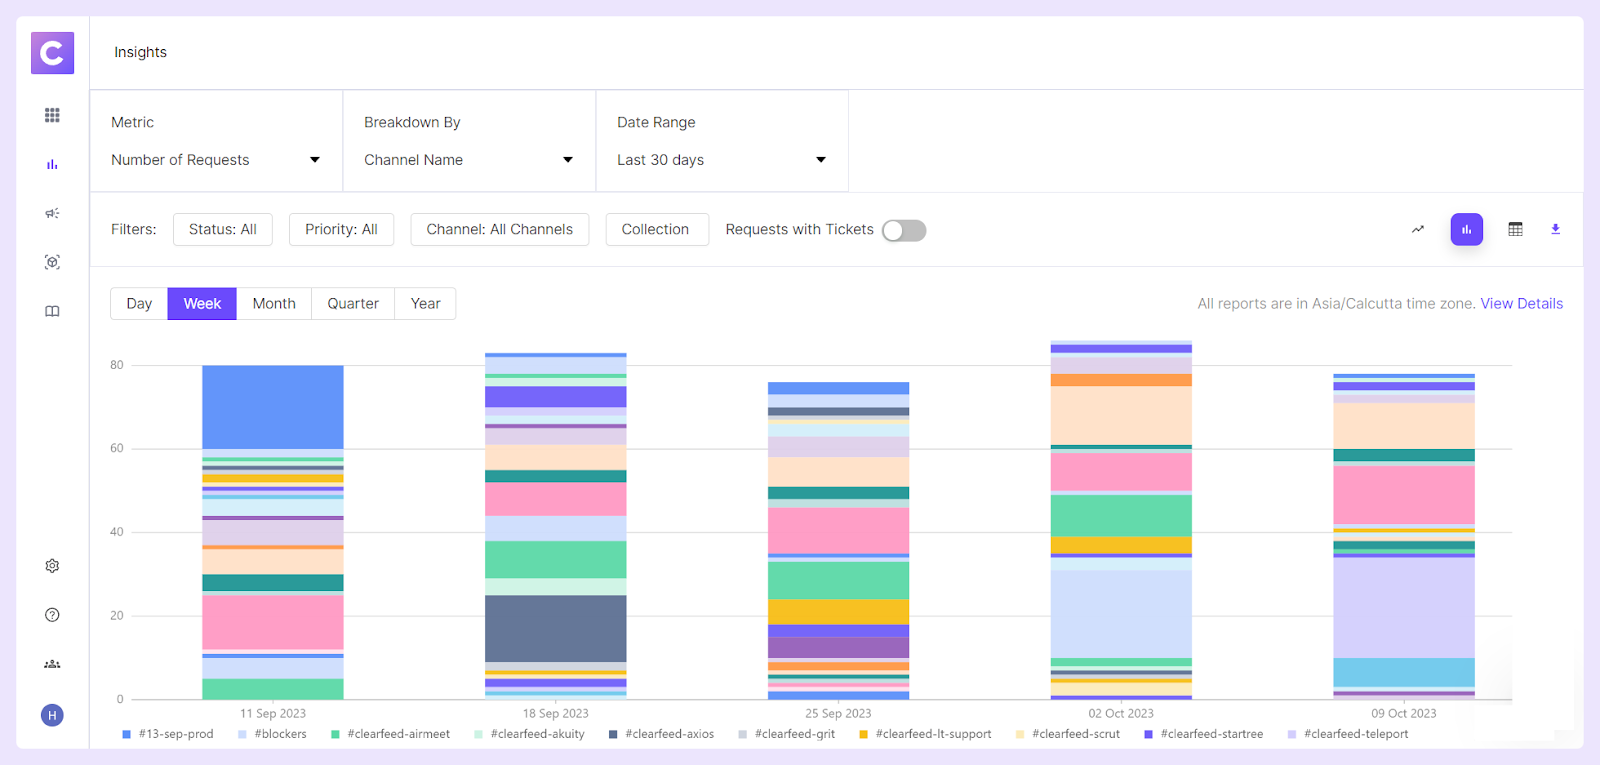
ClearFeed Insights reports request and message volumes and lets teams break down metrics by collection, channel, assignee, custom fields, customer, customer owner, and customer custom fields. This makes ticket volume more useful for capacity planning because managers can see which customers, channels, or categories are driving the load.
2.2. Ticket Backlog: This represents the number of unresolved tickets at any given time and is essentially a measure of 'open' or 'pending' inquiries that haven't been addressed yet.
Maintaining a high ticket backlog indicates inefficiencies in your service system, impacts customer satisfaction negatively, and can lead to Service Level Agreements (SLAs) breaches. Therefore, tracking and managing your ticket backlog is vital.
Frequent monitoring of your ticket backlog can help you identify any bottlenecks in your support process, enabling you to adjust resources or processes accordingly. Moreover, minimizing your backlog ensures faster response times, improving customer satisfaction, customer retention, and overall business growth.
For daily backlog control, ClearFeed Views include team views for Unsolved, Unassigned, Pending with Support, Pending with Customer, First Response Overdue, and Resolution Overdue work. Teams can also create custom views, sync them to Slack Lists, or schedule periodic CSV exports to Slack so aging work stays visible where responders already operate.
2.3. Tickets by Channels: When tracking tickets by channels, you count the number of customer support requests received through different platforms or channels.
These channels may include Slack, MS Teams, email, phone calls, live chat, social media platforms, and other similar mediums and help understand customer preferences and adjust resources accordingly. For example, if you receive most of your tickets via live chat, you might consider investing more in building a robust chat support team.
ClearFeed can route Slack, Slack Connect, Microsoft Teams, email, web chat, customer portal, and API-originated requests into Slack triage and ClearFeed views. For external B2B support, Customer Centric Inbox groups conversations by customer across supported sources, so channel-level metrics can be reviewed alongside customer-level context.
2.4. First Contact Resolution Rate: This is the percentage of tickets resolved upon the initial response without requiring further interactions. A high FCRR indicates that most customer issues are resolved in the first contact, leading to higher customer satisfaction.
Based on the data collected, the formula for calculating the First Contact Resolution Rate is:
First Contact Resolution Rate = Number of Issues Resolved on the First Contact / Total Number of Customer Support Requests * 100
For example, if a customer support team received 1,000 inquiries in a month and resolved 650 of them during the first interaction, the FCRR would be calculated as
FCRR = (650 / 1000) x 100 = 65%
FCRR indicates your team's effectiveness in addressing and resolving customer concerns. Higher FCRRs suggest that your team is well-equipped and trained to resolve issues in a single interaction, reducing the need for repeat contacts and follow-ups.
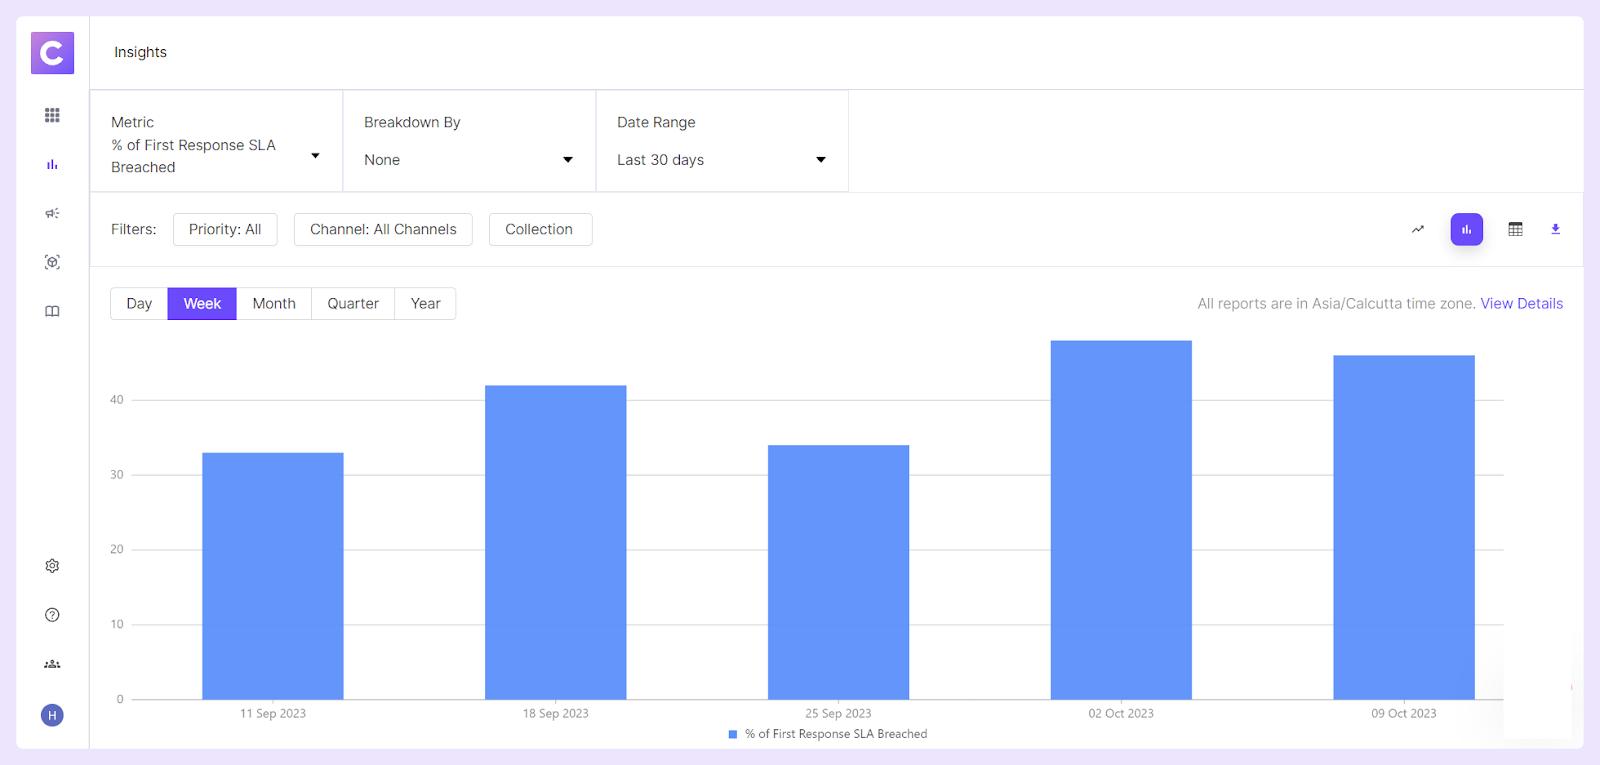
If one-touch resolution matters, ClearFeed SLA policies include a One Touch Resolution target, and Insights reports the percentage of requests that breach that target. This helps teams separate quick-close issues from tickets that need deeper research, engineering help, or customer follow-up.
Customer Satisfaction Score (CSAT)
CSAT is typically measured on a scale. However, the scale itself can differ from company to company - the most common scale being a 5-point or a 7-point Likert scale, ranging from 1 (Very Unsatisfied) to 5 (Very Satisfied) or 1 (Very Unsatisfied) to 7 (Very Satisfied).
The CSAT comes in two variations, Composite customer satisfaction and Detailed customer satisfaction. It can be calculated using the following formulae:
Composite customer satisfaction = Sum of All Scores / Number of Survey Responses * 100
Detailed customer satisfaction = Number of Satisfied Customers (4 and 5 Ratings) / Number of Survey Responses * 100
The higher your CSAT score, the better your customers feel about working with you — and the more likely they will keep coming back. CSAT is also useful as it helps organizations identify opportunities for improvement and increase profitability through loyal customer relationships and repeat business.
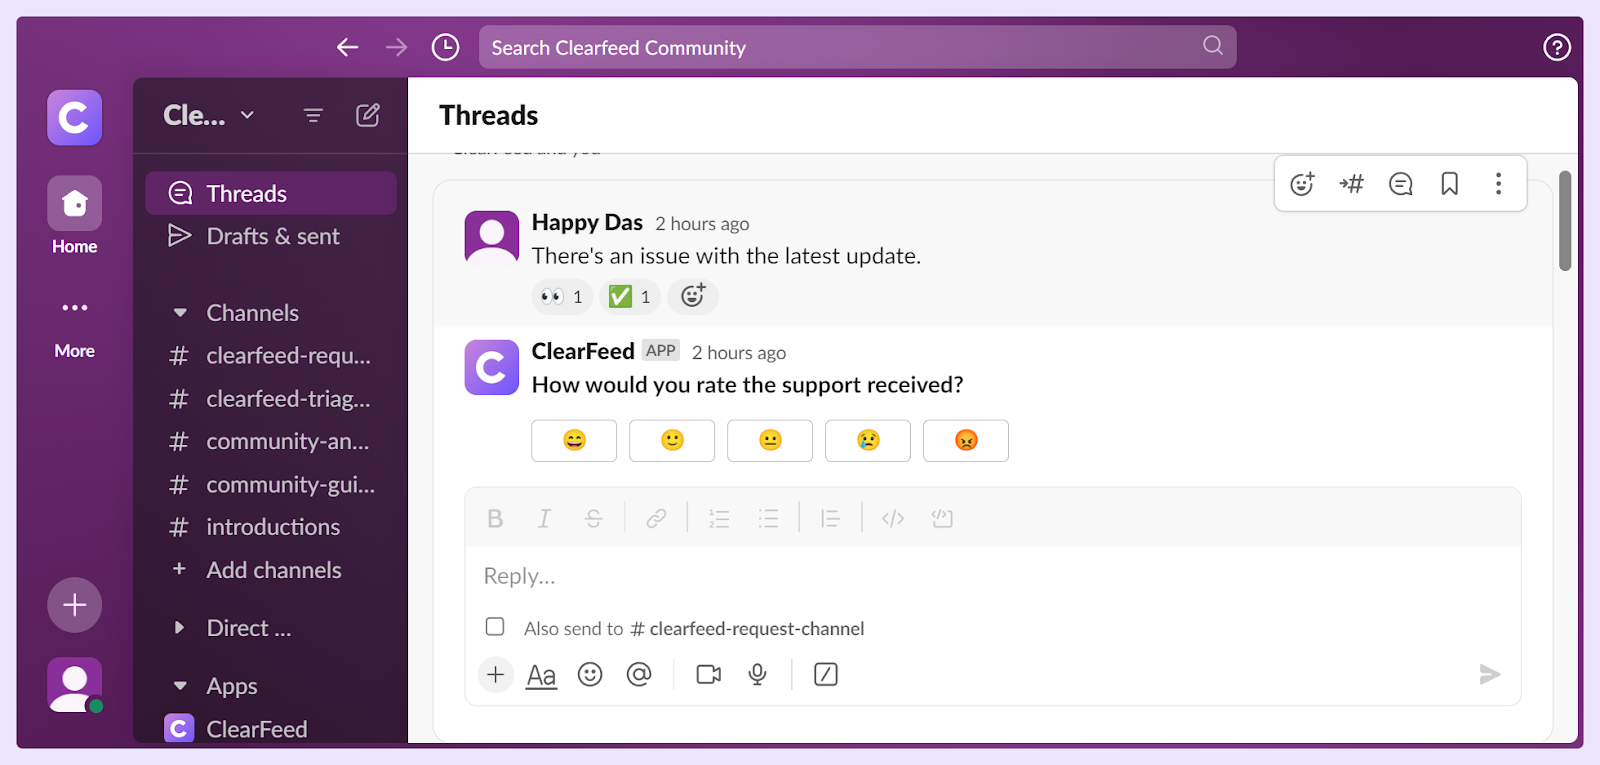
ClearFeed can send Slack-native CSAT surveys when a request or ticket moves to Solved, using either a 5-point emoji survey or a 2-point thumbs up/down survey. Teams can also delay the survey, customize the question, and request comments for selected ratings to capture more useful feedback.
For earlier directional signals, ClearFeed's Auto-CSAT and Auto-Emotion AI fields can be viewed and filtered on the dashboard. Treat these as predictive signals, not replacements for actual requester survey responses.
Customer Effort Score (CES)
Customer Effort Score (CES) is a customer service performance metric that measures the ease with which customers can obtain support and solutions from a company. It gauges customers' efforts to resolve issues, answer questions, or meet needs.
A lower perceived effort typically results in higher customer loyalty, better customer experience, and increased likelihood of repeat business.
Customers rate their effort numerically, often from 1 to 5 or 1 to 7. A popular approach to collecting CES data is asking customers: "How easy was it to interact with our support team?" or "How much effort did you have to put forth to handle your request?".
The CES score is calculated using the following formula:
Customer Effort Score = Sum of All Individual Effort Ratings / Number of Responses
CES metric empowers businesses to
- Spot recurring problems swiftly and mitigate potential major customer pain points before they escalate.
- Unearth existing gaps in your customer support agents' capabilities to create targeted training opportunities.
- Set realistic, accurate customer expectations for critical aspects, such as response times and resolution timelines.
ClearFeed can also reduce perceived effort by letting requesters stay in their preferred channel while responders work from Slack triage or the ClearFeed web app. AI Agents can run in Virtual Agent mode for requester-facing answers or Agent Assistant mode for private responder suggestions, while ClearBot Assist can summarize long threads, surface previous requests, and insert quick replies from triage.
Average Resolution Time
Average Resolution Time (ART) is a critical customer service metric measuring a customer support team's average time to resolve a ticket. The timeframe includes all actions related to the ticket, from its creation to its final resolution.
The formula would be as follows:
Average Resolution Time = Total Resolution Time / Total Number of Resolved Tickets
Measuring ART helps identify inefficiencies within the customer support process and highlight problems like delayed responses, lack of resources, or issues that take a long time to resolve, informing strategies for improvement.
Moreover, companies often have Service Level Agreements (SLAs) that commit to resolving issues within a certain timeframe. Tracking ART can help ensure compliance with these SLAs and avoid violations.
ClearFeed's SLA settings let teams define resolution targets by collection and ticket properties, calculate them against business schedules, and optionally pause resolution timers while a ticket is Pending. That keeps resolution-time reporting closer to the team's active handling effort when they are waiting on a customer or an external dependency.
Net Promoter Score (NPS)
Net Promoter Score (NPS) is a key performance indicator measuring customer loyalty, satisfaction, and enthusiasm towards a company's products or services. It is calculated based on responses to a single question: "On a scale of 0-10, how likely are you to recommend our company/product/service to a friend or colleague?".
The responses to this question categorize customers into three segments:
The NPS score is calculated using the following formula:
NPS = % Promoters - % Detractors
By analyzing patterns in NPS data, you can uncover areas of your product or service that might need improvements, contributing to overall customer satisfaction.
Here are five reasons you should be measuring net promoter score (NPS)
- Drive customer loyalty
- Benchmark against competitors
- Identify promoters and detractors
- Get real-time feedback
- Improve the product or service offering
If you collect NPS outside ClearFeed, customer-level ClearFeed Insights can provide useful support context around that loyalty signal. Reports can be broken down by customer, customer owner, customer custom fields, and request custom fields, helping teams review recurring issue types, SLA performance, and support ownership alongside NPS trends.
Average Ticket Handling Time
Average ticket handling time (ATH) is an essential customer service metric that measures the average time a customer support team takes to manage or "handle" customers' queries or issues from when the ticket is created until its resolution.
The average ticket handling time includes all activities related to a ticket, such as:
The formula to calculate the ATH is as follows:
Average Ticket Handling Time = Total Ticket Handling Time / Total Number of Tickets
The quicker a service team resolves an issue, the better the customer's experience. Hence, a lower ATH often leads to greater customer satisfaction. Further, companies often set SLAs with their customers, promising to resolve support issues within a given timeframe. Monitoring the ATH helps to ensure compliance with these SLAs.
To reduce handling time without losing context, ClearFeed supports assignment rules, quick replies, private comments, AI-assisted reply drafting, and task escalation to Jira, Linear, GitHub, ClickUp, or Asana while the original customer-facing request remains tracked. This is especially useful when support needs engineering help but still owns the customer response.
Get Your Customer Support Team on Point
Ultimately, the best way to improve customer support is by first measuring the most important metrics. The metrics you choose to track can be challenging initially, but they will be worth the investment. This is because you can track the process and the different elements of your customer support to understand better how your team impacts your business.
When you see what is working, you can build upon it. Dedicating time and resources to optimize your customer service team's performance will show that your business is dedicated to providing the best quality product possible. Making these measurements allows you to spot trends, pinpoint areas for improvement, and be better positioned to make informed decisions and align your strategy around what works.
If your support motion already lives in Slack, ClearFeed connects these metrics back to the work itself: conversations can be converted into requests or tickets, routed through assignment rules and automations, measured in Insights, reviewed in saved views and digests, and enriched with CSAT, AI Fields, and Virtual Agent reporting.
ClearFeed's Insights functionality enables businesses to understand not only the productivity of their service team but also to analyze quality and performance on a granular level, optimize the customer experience, and make data-driven decisions for the future.
FAQs
1. How to Measure Customer Service Metrics?
Customer Service Metrics can be measured in several ways. It typically involves collecting data through various channels like feedback surveys, tracking software, and direct interactions.
2. What Are Customer Service Metrics?
Customer Service Metrics are quantitative measures used to track and evaluate the quality of the customer service provided by an organization. This can include metrics like Customer Satisfaction (CSAT), Net Promoter Score (NPS), First Response Time (FRT), Average Resolution Time (ART), and Customer Effort Score (CES), among others, shedding light on the overall customer experience and the effectiveness of service operations.
3. Do Metrics Work in Customer Service?
Yes, metrics work effectively in customer service. They are critical to assessing the customer's experience, providing actionable data for improvements, and formulating strategic plans to enhance service efficiency. Metrics offer an objective way to measure and benchmark service teams' performance.
4. Why Metrics Are Important in Customer Service?
Metrics are crucial in customer service for several reasons. They allow businesses to measure, analyze, and improve their service by identifying areas of strength and weakness. Metrics enable teams to set and track performance goals, enhance customer satisfaction, and drive loyalty. They also help make informed decisions on resource allocation and strategic planning for service improvements.